28Jun

RAG Survey & Available Research Overview


RAG Survey & Available Research

A Survey on Retrieval-Augmented Text Generation for Large Language Models

Recap On RAG

Retrieval-Augmented Generation (RAG) combines retrieval methods with In-Context Learning (ICL) & Natural Language Generation (NLG) to overcome the static knowledge limitations of large language models (LLMs) by integrating dynamic external information.

This approach primarily targets the text domain and offers a cost-effective solution to mitigate the generation of plausible but incorrect responses by LLMs, thus improving their accuracy and reliability through the use of real-world data.

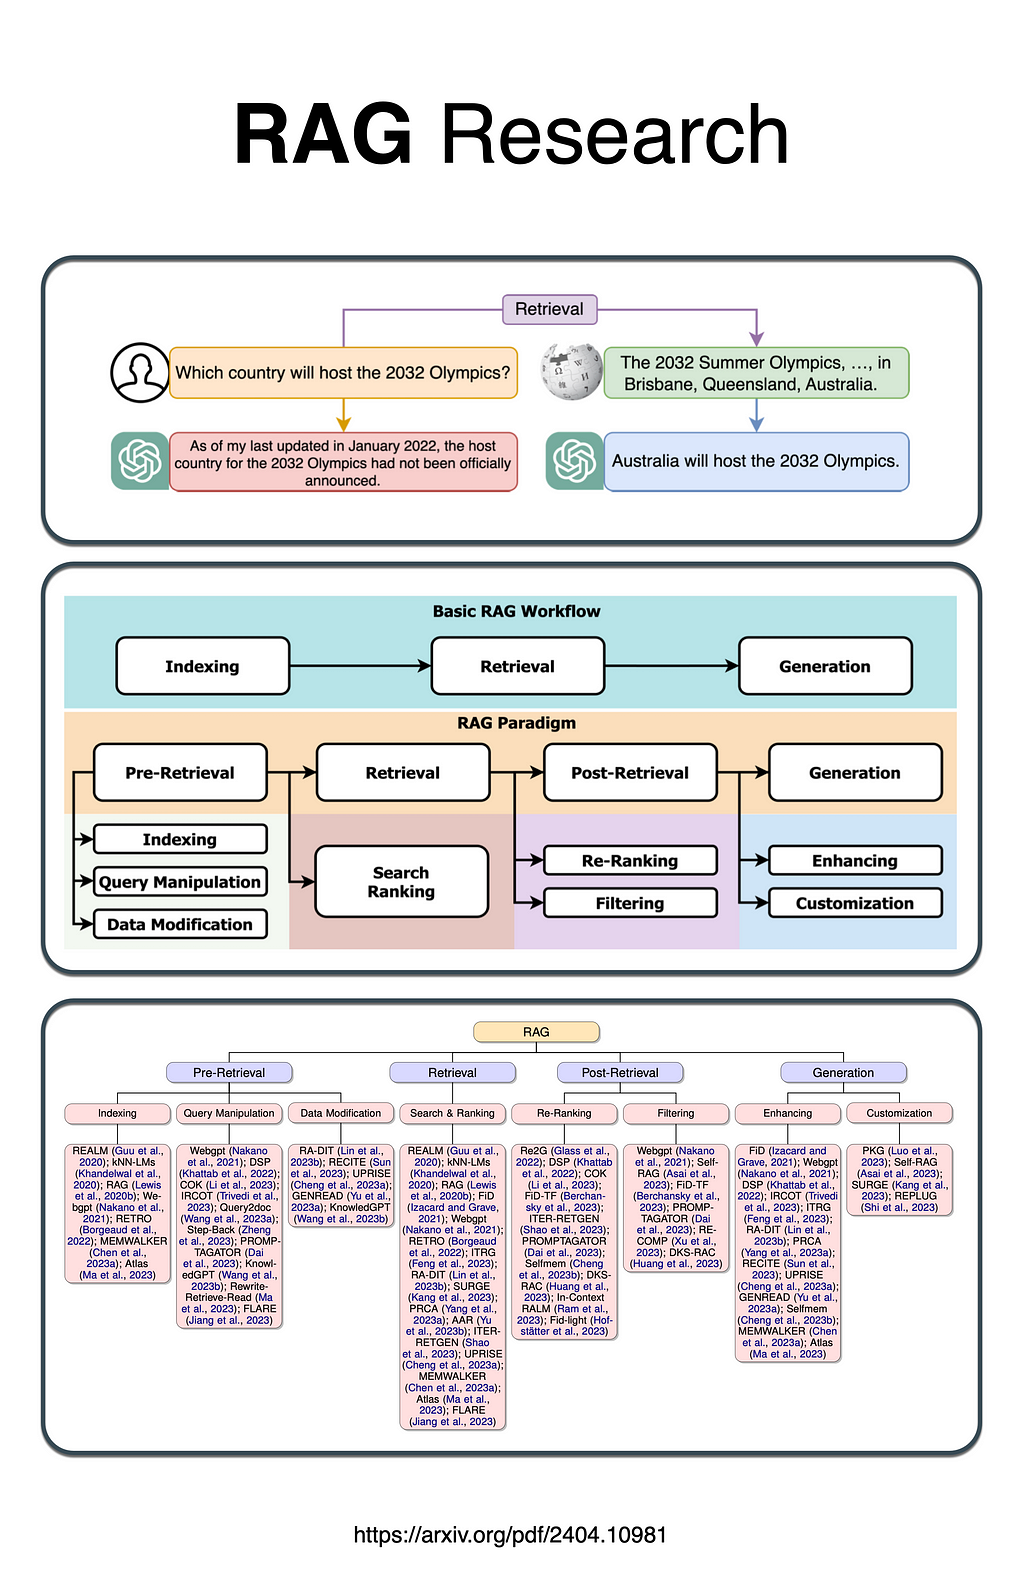
𝗥𝗔𝗚 𝗶𝘀 𝗰𝗮𝘁𝗲𝗴𝗼𝗿𝗶𝘀𝗲𝗱 𝗶𝗻𝘁𝗼 𝗳𝗼𝘂𝗿 𝗸𝗲𝘆 𝘀𝘁𝗮𝗴𝗲𝘀:
𝗣𝗿𝗲-𝗿𝗲𝘁𝗿𝗶𝗲𝘃𝗮𝗹,
𝗥𝗲𝘁𝗿𝗶𝗲𝘃𝗮𝗹,
𝗣𝗼𝘀𝘁-𝗿𝗲𝘁𝗿𝗶𝗲𝘃𝗮𝗹, &
𝗚𝗲𝗻𝗲𝗿𝗮𝘁𝗶𝗼𝗻.

It also introduces evaluation methods for RAG, addressing the challenges faced and suggesting future research directions. By offering a structured framework and categorisation, the study aims to consolidate existing research on RAG, clarify its technological foundations, and emphasise its potential to expand the adaptability and applications of LLMs.

The paper highlights how RAG can dynamically integrate up-to-date information to enhance the performance of LLMs, making them more reliable and effective in generating accurate responses, thereby broadening their practical uses in various domains.

The image below shows a basic RAG workflow, but also the sub-components liked to the four RAG steps.

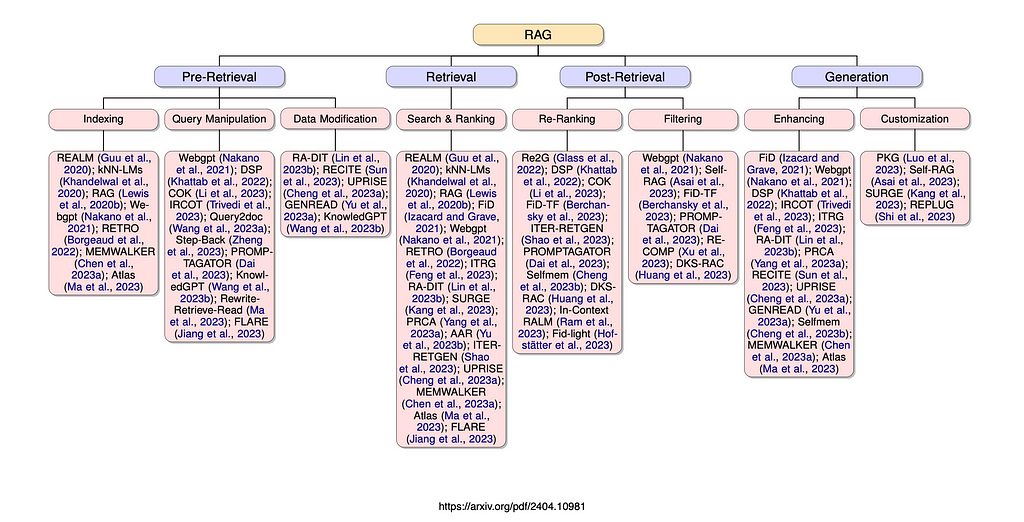
The image below contains a list of all the existing research for each of RAG components.

⭐️ Follow me on LinkedIn for updates on Large Language Models ⭐️

I’m currently the Chief Evangelist @ Kore AI. I explore & write about all things at the intersection of AI & language; ranging from LLMs, Chatbots, Voicebots, Development Frameworks, Data-Centric latent spaces & more.

LinkedIn


Source link

27Jun

Classification Loss Functions: Intuition and Applications | by Ryan D’Cunha | Jun, 2024


A simpler way to understand derivations of loss functions for classification and when/how to apply them in PyTorch

Source: GPT4o Generated

Whether you are new to exploring neural networks or a seasoned pro, this should be a beneficial read to gain more intuition about loss functions. As someone testing many different loss functions during model training, I would get tripped up on small details between functions. I spent hours researching an intuitive depiction of loss functions from textbooks, research papers, and videos. I wanted to share not only the derivations that helped me grasp the concepts, but common pitfalls and use cases for classification in PyTorch.

Before we get started, we need to define some basic terms I will be using.

  • Training dataset: {xᵢ, yᵢ}
  • Loss function: L[φ]
  • Model prediction output f[xᵢ, φ] with parameters φ
  • Conditional probability: Pr(y|x)
  • Parametric distribution: Pr(y|ω) with ω representing network parameters for distribution over y

Let’s first go back to the basics. A common thought is that neural networks compute a scalar output from the model f[xᵢ, φ]. However, most neural networks these days are trained to predict parameters of a distribution y. (as oppose to to predicted the value of y).

In reality, a network will output a conditional probability distribution Pr(y|x) over possible outputs y. In other words, every input data point will lead to a probability distribution generated for each output. The network wants to learn the parameters for the probability distribution and then use the parameters and distribution to predict the output.

The traditional definition of a loss function is a function that compares target and predicted outputs. But we just said a network raw output is a distribution instead of a scalar output, so how is this possible?

Thinking about this from the view we just defined, a loss function pushes each yᵢ to have a higher probability in the distribution Pr(yᵢ|xᵢ). The key part to remember is that our distribution is being used to predict the true output based on parameters from our model output. Instead of using our input xᵢ for the distribution, we can think of a parametric distribution Pr(y|ω) where ω represents probability distribution parameters. We are still considering the input, but there will be a different ωᵢ = f[xᵢ, φ] for each xᵢ.

Note: To clarify a confusing concept, φ represents the model parameters and ω represents the probability distribution parameters

Going back to the traditional definition of a loss function, we need to get an output we can use from the model. From our probability distribution, it seems logical to take φ that produces the greatest probability for each xᵢ. Thus, we need the overall φ that produces the greatest probability across all training points I (all derivations are adapted from Understanding Deep Learning [1]):

Maximizing parameters from output model probability distributions [1]

We multiply the generated probabilities from each distribution to find φ that produces the maximum probability (called max likelihood). In order to do this, we must assume the data is independent and identically distributed. But now we run into a problem: what if the probabilities are very small? Our multiplication output will approach 0 (similar to a vanishing gradient issue). Furthermore, our program may not be able to process such small numbers.

To fix this, we bring in a logarithmic function! Utilizing the properties of logs, we can add together our probabilities instead of multiplying them. We know that the logarithm is a monotonically increasing function, so our original output is preserved and scaled by the log.

Using logarithms to add probabilities [1]

The last thing we need to get our traditional negative log-likelihood is to minimize the output. We are currently maximizing the output, so simply multiply by a negative and take the minimum argument (think about some graphical examples to convince yourself of this):

Negative Log-Likelihood [1]

Just by visualizing the model output as a probability distribution, attempting to maximize φ that creates the max probability, and applying a log, we have derived negative log-likelihood loss! This can be applied to many tasks by choosing a logical probability distribution. Common classification examples are shown below.

If you are wondering how a scalar output is generated from the model during inference, it’s just the max of the distribution:

Generating an output from inference [1]

Note: This is just a derivation of negative log-likelihood. In practice, there will most likely be regularization present in the loss function too.

Up to this point, we derived negative log-likelihood. Important to know, but it can be found in most textbooks or online resources. Now, let’s apply this to classification to understand it’s application.

Side note: If you are interested in seeing this applied to regression, Understanding Deep Learning [1] has great examples with univariate regression and a Gaussian Distribution to derive Mean Squared Error

Binary Classification

The goal of binary classification is to assign an input x to one of two class labels y ∈ {0, 1}. We are going to use the Bernoulli distribution as our probability distribution of choice.

Mathematical Representation of Bernoulli Distribution. Image by Author

This is just a fancy way of saying the probability that the output is true, but the equation is necessary to derive our loss function. We need the model f[x, φ] to output p to generate the predicted output probability. However, before we can input p into Bernoulli, we need it to be between 0 and 1 (so it’s a probability). The function of choice for this is a sigmoid: σ(z)

Source: https://en.wikipedia.org/wiki/Sigmoid_function

A sigmoid will compress the output p to between 0 and 1. Therefore our input to Bernoulli will be p = σ(f[x, φ]). This makes our probability distribution:

New Probability Distribution with Sigmoid and Bernoulli. Image by Author

Going back to negative log-likehood, we get the following:

Binary Cross Entropy. Image by Author

Look familiar? This is the binary cross entropy (BCE) loss function! The main intuition with this is understanding why a sigmoid is used. We have a scalar output and it needs to be scaled to between 0 and 1. There are other functions capable of this, but the sigmoid is the most commonly used.

BCE in PyTorch

When implementing BCE in PyTorch, there are a few tricks to watch out for. There are two different BCE functions in PyTorch: BCELoss() and BCEWithLogitsLoss(). A common mistake (that I have made) is incorrectly swapping the use cases.

BCELoss(): This torch function outputs the loss WITH THE SIGMOID APPLIED. The output will be a probability.

BCEWithLogitsLoss(): The torch function outputs logits which are the raw outputs of the model. There is NO SIGMOID APPLIED. When using this, you will need to apply a torch.sigmoid() to the output.

This is especially important for Transfer Learning as the model even if you know the model is trained with BCE, make sure to use the right one. If not, you make accidentally apply a sigmoid after BCELoss() causing the network to not learn…

Once a probability is calculated using either function, it needs to be interpreted during inference. The probability is the model’s prediction of the likelihood of being true (class label of 1). Thresholding is needed to determine the cutoff probability of a true label. p = 0.5 is commonly used, but it’s important to test out and optimize different threshold probabilities. A good idea is to plot a histogram of output probabilities to see the confidence of outputs before deciding on a threshold.

Multiclass Classification

The goal of multiclass classification is to assign an input x to one of K > 2 class labels y ∈ {1, 2, …, K}. We are going to use the categorical distribution as our probability distribution of choice.

Categorical Distribution. Image by Author

This is just assigning a probability for each class for a given output and all probabilities must sum to 1. We need the model f[x, φ] to output p to generate the predicted output probability. The sum issue arises as in binary classification. Before we can input p into Bernoulli, we need it to be a probability between 0 and 1. A sigmoid will no longer work as it will scale each class score to a probability, but there is no guarantee all probabilities will sum to 1. This may not immediately be apparent, but an example is shown:

Sigmoid does not generate probability distribution in multiclass classification. Image by Author

We need a function that can ensure both constraints. For this, a softmax is chosen. A softmax is an extension of a sigmoid, but it will ensure all the probabilities sum to 1.

Softmax Function. Image by Author

This means the probability distribution is a softmax applied to the model output. The likelihood of calculating a label k: Pr(y = k|x) = Sₖ(f[x, φ]).

To derive the loss function for multiclass classification, we can plug the softmax and model output into the negative log-likelihood loss:

Multiclass Cross Entropy. Image by Author

This is the derivation for multiclass cross entropy. It is important to remember the only term contributing to the loss function is the probability of the true class. If you have seen cross entropy, you are more familiar with a function with a p(x) and q(x). This is identical to the cross entropy loss equation shown where p(x) = 1 for the true class and 0 for all other classes. q(x) is the softmax of the model output. The other derivation of cross entropy comes from using KL Divergence, and you can reach the same loss function by treating one term as a Dirac-delta function where true outputs exist and the other term as the model output with softmax. It is important to note that both routes lead to the same loss function.

Cross Entropy in PyTorch

Unlike binary cross entropy, there is only one loss function for cross entropy in PyTorch. nn.CrossEntropyLoss returns the model output with the softmax already applied. Inference can be performed by taking the largest probability softmax model output (taking the highest probability as would be expected).

These were two well studied classification examples. For a more complex task, it may take some time to decide on a loss function and probability distribution. There are a lot of charts matching probability distributions with intended tasks, but there is always room to explore.

For certain tasks, it may be helpful to combine loss functions. A common use case for this is in a classification task where it maybe helpful to combine a [binary] cross entropy loss with a modified Dice coefficient loss. Most of the time, the loss functions will be added together and scaled by some hyperparameter to control each individual functions contribution to loss.


Source link

26Jun

FlowMind Is An Automatic Workflow Generator | by Cobus Greyling | Jun, 2024


RAG & API Retrieval, Partitioning & Extraction

FlowMind aims to solve for hallucination by providing contextual reference data at inference; analogous to RAG. The API also seeks to retrieve, partition and extract relevant XML-like blocks. Blocks are again very much similar to chunks.

FlowMind is also challenged by the problems of selecting the top retrieved blocks/chunks and truncating blocks which are too long.

Embeddings are also used in FlowMind to search according to semantic similarity.

So FlowMind can be considered as JPMorganChase’s propriety RAG solution and obviously it meets their data privacy and governance requirements. What I find curious is that the market in general has settled on certain terminology and a shared understanding has been developed.

JPMorganChase breaks from these terms and introduces their own lexicon. However, FlowMind is very much comparable to RAG in general.

It is evident that through this implementation, JPMorganChase has full control over their stack on a very granular level. The process and flow Python functions created by FlowMind most probably fits into their current ecosystem.

MindFlow can also be leveraged by skilled users to generate flows based on a description which can be re-used.

The aim of FlowMind is to remedy hallucination in Large Language Models (LLMs) while ensuring there is no direct link between the LLM and proprietary code or data.

FlowMind creates flows or pipelines on the fly, a process the paper refers to as robotic process automation. There is a human-in-the-loop element, which can also be seen as a single dialog turn, allowing users to interact with and refine the generated workflows.

Application Programming Interfaces (APIs) are used for grounding the LLMs, serving as a contextual reference to guide their reasoning. This is followed by code generation, code execution, and ultimately delivering the final answer.

Stage 1: It begins by following a structured lecture plan (prompt template as seen above) to create a lecture prompt. This prompt educates the Large Language Model (LLM) about the context and APIs, preparing it to write code.


Source link

25Jun

Can Conversation Designers Excel As Data Designers? | by Cobus Greyling | Jun, 2024


The Emergence Of Data Design to create highly granular, conversational & refined data for language model fine-tuning.

Recent research and development have highlighted the emergence of Data Design in model training and fine-tuning processes.

This phenomenon is that models are trained not to necessarily imbue the model with knowledge, hence augmenting the Knowledge Intensive nature of the model.

But rather change the behaviour of the model, teaching the model new behaviour.

Can Conversation Designers Excel As Data Designers?

There has been many discussions on the future of conversation designers…and an idea came to mind…many of these datasets require human involvement in terms of annotation and oversight.

And these datasets hold key elements of dialog, reasoning and chains of thought…

So, the question which has been lingering in the back of my mind for the last couple of days is, is this not such a well suited task for conversation designers?

Especially in getting the conversational and thought process topology of the data right?

Allow me to explain, I have been talking much about a data strategy needing to consist of the Eight D’s: data discovery, data design, data development and data delivery.

Data delivery has been discuss much considering RAG and other delivery strategies.

Data Discovery has also been addressed to some degree, for instance XO Platform’s Intent Discovery. However, there is still much to do in finding new development opportunities…

Coming to Data Design…in this article I discuss three recent studies which focusses on teaching language models (both large and small) certain behaviours. While not necessarily imbuing the model with specific world knowledge, but rather improving the behaviour and abilities of the model.

These abilities can include self correction, reasoning abilities, improving contextual understanding, both short and long, and more…


Source link

24Jun

Combining ORPO and Representation Fine-Tuning for Efficient LLAMA3 Alignment | by Yanli Liu | Jun, 2024


Achieving Better Results and Efficiency in Language Model Fine-Tuning

11 min read

10 hours ago

Fine-tuning is one of the most popular techniques for adapting language models to specific tasks.

However, in most cases, this will require large amounts of computing power and resources.

Recent advances, among them PeFT, the parameter-efficient fine-tuning such as the Low-Rank Adaptation method, Representation Fine-Tuning, and ORPO


Source link

22Jun

Comprehensive Guide to Datasets and Dataloaders in PyTorch | by Ryan D’Cunha | Jun, 2024


The full guide to creating custom datasets and dataloaders for different models in PyTorch

Source: GPT4o Generated

Before you can build a machine learning model, you need to load your data into a dataset. Luckily, PyTorch has many commands to help with this entire process (if you are not familiar with PyTorch I recommend refreshing on the basics here).

PyTorch has good documentation to help with this process, but I have not found any comprehensive documentation or tutorials towards custom datasets. I’m first going to start with creating basic premade datasets and then work my way up to creating datasets from scratch for different models!

Before we dive into code for different use cases, let’s understand the difference between the two terms. Generally, you first create your dataset and then create a dataloader. A dataset contains the features and labels from each data point that will be fed into the model. A dataloader is a custom PyTorch iterable that makes it easy to load data with added features.

DataLoader(dataset, batch_size=1, shuffle=False, sampler=None,
batch_sampler=None, num_workers=0, collate_fn=None,
pin_memory=False, drop_last=False, timeout=0,
worker_init_fn=None, *, prefetch_factor=2,
persistent_workers=False)

The most common arguments in the dataloader are batch_size, shuffle (usually only for the training data), num_workers (to multi-process loading the data), and pin_memory (to put the fetched data Tensors in pinned memory and enable faster data transfer to CUDA-enabled GPUs).

It is recommended to set pin_memory = True instead of specifying num_workers due to multiprocessing complications with CUDA.

In the case that your dataset is downloaded from online or locally, it will be extremely simple to create the dataset. I think PyTorch has good documentation on this, so I will be brief.

If you know the dataset is either from PyTorch or PyTorch-compatible, simply call the necessary imports and the dataset of choice:

from torch.utils.data import Dataset
from torchvision import datasets
from torchvision.transforms imports ToTensor

data = torchvision.datasets.CIFAR10('path', train=True, transform=ToTensor())

Each dataset will have unique arguments to pass into it (found here). In general, it will be the path the dataset is stored at, a boolean indicating if it needs to be downloaded or not (conveniently called download), whether it is training or testing, and if transforms need to be applied.

I dropped in that transforms can be applied to a dataset at the end of the last section, but what actually is a transform?

A transform is a method of manipulating data for preprocessing an image. There are many different facets to transforms. The most common transform, ToTensor(), will convert the dataset to tensors (needed to input into any model). Other transforms built into PyTorch (torchvision.transforms) include flipping, rotating, cropping, normalizing, and shifting images. These are typically used so the model can generalize better and doesn’t overfit to the training data. Data augmentations can also be used to artificially increase the size of the dataset if needed.

Beware most torchvision transforms only accept Pillow image or tensor formats (not numpy). To convert, simply use

To convert from numpy, either create a torch tensor or use the following:

From PIL import Image
# assume arr is a numpy array
# you may need to normalize and cast arr to np.uint8 depending on format
img = Image.fromarray(arr)

Transforms can be applied simultaneously using torchvision.transforms.compose. You can combine as many transforms as needed for the dataset. An example is shown below:

import torchvision.transforms.Compose

dataset_transform = transforms.Compose([
transforms.RandomResizedCrop(256),
transforms.RandomHorizontalFlip(),
transforms.ToTensor(),
transforms.Normalize([0.485, 0.456, 0.406], [0.229, 0.224, 0.225])
])

Be sure to pass the saved transform as an argument into the dataset for it to be applied in the dataloader.

In most cases of developing your own model, you will need a custom dataset. A common use case would be transfer learning to apply your own dataset on a pretrained model.

There are 3 required parts to a PyTorch dataset class: initialization, length, and retrieving an element.

__init__: To initialize the dataset, pass in the raw and labeled data. The best practice is to pass in the raw image data and labeled data separately.

__len__: Return the length of the dataset. Before creating the dataset, the raw and labeled data should be checked to be the same size.

__getitem__: This is where all the data handling occurs to return a given index (idx) of the raw and labeled data. If any transforms need to be applied, the data must be converted to a tensor and transformed. If the initialization contained a path to the dataset, the path must be opened and data accessed/preprocessed before it can be returned.

Example dataset for a semantic segmentation model:

from torch.utils.data import Dataset
from torchvision import transforms

class ExampleDataset(Dataset):
"""Example dataset"""

def __init__(self, raw_img, data_mask, transform=None):
self.raw_img = raw_img
self.data_mask = data_mask
self.transform = transform

def __len__(self):
return len(self.raw_img)

def __getitem__(self, idx):
if torch.is_tensor(idx):
idx = idx.tolist()

image = self.raw_img[idx]
mask = self.data_mask[idx]

sample = {'image': image, 'mask': mask}

if self.transform:
sample = self.transform(sample)

return sample


Source link

20Jun

Should You Join FAANG or a Startup as a Data Scientist? | by Torsten Walbaum | Jun, 2024


Lessons from working at Uber + Meta, a growth stage company and a tiny startup

Image by author (created via Midjourney)

What type of company you join is an incredibly important decision. Even if the company is prestigious and pays you well, if the work environment is not a fit, you’ll burn out eventually.

Many people join a startup or a big tech company without a good understanding of what it’s actually like to work there, and often end up disappointed. In this article, I will cover the key differences based on my experience working at companies ranging from a small 10-person startup to big tech giants like Uber and Meta. Hopefully this will help you decide where you want to go.

If you want to skim the article, I am adding a brief summary (“TL;DR” = “Too long, didn’t read”) at the end of each section (something I learned at Uber).

Think of a tech company you know. Chances are, you thought of Google, Meta, Amazon, Apple or a similar large company.

Based on these companies’ reputation, most people assume that anyone who works there meets a very high bar for excellence. While that’s not necessarily true (more on that below), this so-called “halo effect” can help you. Once you have the “stamp of approval” from a big tech company on your resume, it is much easier to find a job afterwards.

Many companies think: “If that person is good enough to be a Data Scientist at Google, they will be good enough for us. I’m sure Google did their due diligence”.

Coming to the US from Germany, most hiring managers and recruiters didn’t know the companies I used to work for. Once I got a job at Uber, I was flooded with offers, including from companies that had rejected me before.

You might find that unfair, but it’s how the system currently works, and you should consider this when choosing a company to work for.

TL;DR: Working for a prestigious company early in your career can open a lot of doors.

As mentioned above, people often assume that FAANG companies only hire the best and brightest.

In reality, that’s not the case. One thing I learned over the years is that any place in the world has a normal distribution of skill and talent once it reaches a certain size. The distribution might be slightly offset on the X axis, but it’s a normal distribution nonetheless.

Image by author

Many of of the most well-known companies started out being highly selective, but as they grew and ramped up hiring, the level of excellence started reverting to the mean.

Counterintuitively, that means that some small startups have more elite teams than big tech companies because they can afford to hand-pick every single new hire. To be sure, you’ll need to judge the caliber of the people first-hand during the interview process.

TL;DR: You’ll find smart people in both large and small companies; it’s a fallacy that big tech employs higher-caliber people than startups.

How much you’ll earn depends on many factors, including the specific company, the level you’re being offered, how well you negotiate etc.

The main thing to keep in mind: It’s not just about how much you make, but also how volatile and liquid your compensation is. This is affected by the composition of your pay package (salary vs. equity (illiquid private company-stock vs. liquid public company stock)) and the stage of the company.

Here is how you can think about it at a high level:

  • Early-stage: Small startups will offer you lower base salaries and try to make up for that by promising high equity upside. But betting on the equity upside of an early-stage startup is like playing roulette. You might hit it big and never have to work again, but you need to be very lucky; the vast majority of startups fail, and very few turn into unicorns.
  • Big Tech: Compensation in big tech companies, on the other hand, is more predictable. The base salary is higher (e.g. see the O’Reilly 2016 Data Science Salary Survey) and the equity is typically liquid (i.e. you can sell it as soon as it vests) and less volatile. This is a big advantage since in pre-IPO companies you might have to wait years for your equity to actually be worth something.
  • Growth stage: Growth stage companies can be an interesting compromise; they have a much higher chance of exiting successfully, but your equity still has a lot of upside. If you join 2–3 top-tier growth stage companies over the years, there is a good chance you’ll end up with at least one solid financial outcome. Pay in some of these companies can be very competitive; my compensation actually increased when I moved from Meta to Rippling.

TL;DR: Instead of just focusing on salary, choose the pay package that fits your appetite for risk and liquidity needs.

We all want job security.

We might not stay in a job for our entire career, but at least we want to be able to choose ourselves when we leave.

Startups are inherently riskier than big companies. Is the founder up to the job? Will you be able to raise another round of financing? Most of these risks are existential; in other words, the earlier the stage of the company you join, the more likely it is it won’t exist anymore 6–12 months from now.

Image by author

At companies in later stages, some of these risks have already been eliminated or at least reduced.

In exchange, you’re adding another risk, though: Increased layoff risk. Startups only hire for positions that are business critical since they are strapped for cash. If you get hired, you can be sure they really needed another Data Scientist and there is plenty of work for you to do that is considered central to the startup’s success.

In large companies, though, hiring is often less tightly controlled, so there is a higher risk you’ll be hired into a role that is later deemed “non-essential” and you will be part of sweeping layoffs.

TL;DR: The earlier the company stage, the more risk you take on. But even large companies aren’t “safe” anymore (see: layoffs)

A job at a startup and a large company are very different.

The general rule of thumb is that in earlier-stage companies you’ll have a broader scope. For example, if you join as the first data hire in a startup, you’ll likely act as part Data Engineer, part Data Analyst and part Data Scientist. You’ll need to figure out how to build out the data infrastructure, make data available to business users, define metrics, run experiments, build dashboards, etc.

Your work will also likely range across the entire business, so you might work with Marketing & Sales data one day, and with Customer Support data the next.

In a large company, you’ll have a narrowly defined scope. For example, you might spend most of your time forecasting a certain set of metrics.

The trade-off here is breadth vs. depth & scale: At a startup, your scope is broad, but because you are stretched so thin, you don’t get to go deep on any individual problem. In a large company, you have a narrow scope, but you get to develop deep subject matter expertise in one particular area; if this expertise is in high demand, specializing like this can be a very lucrative path. In addition, anything you do touches millions or even billions of users.

TL;DR: If you want variety, join a startup. If you want to build deep expertise and have impact at scale, join Big Tech. A growth stage company is a good compromise.

When I joined UberEats in 2018, I didn’t get any onboarding. Instead, I was given a set of problems to solve and asked to get going.

If you are used to learning in a structured way, e.g. through lectures in college, this can be off-putting at first. How are you supposed to know how to do this? Where do you even start?

But in my experience, working on a variety of challenging problems is the best way to learn about how a business works and build out your hard and soft skills. For example, coming out of school my SQL was basic at best, but being thrown into the deep end at UberEats forced me to become good at it within weeks.

The major downside of this is that you don’t learn many best practices. What does a best-in-class data infrastructure look like? How do the best companies design their metrics? How do you execute thousands of experiments in a frictionless way while maintaining rigor? Even if you ultimately want to join a startup, seeing what “good” looks like can be helpful so you know what you’re building towards.

In addition, large companies often have formalized training. Where in a startup you have to figure everything out yourself, big tech companies will typically provide sponsored learning and development offerings.

TL;DR: At early-stage companies you learn by figuring things out yourself, at large companies you learn through formal training and absorbing best practices.

We already talked about how working at prestigious companies can help when you’re looking for a new job. But what about your growth within the company?

At an early-stage company, your growth opportunities come as a direct result of the growth of the company. If you join as an early data hire and you and the company are both doing well, it’s likely you’ll get to build out and lead a data team.

Most of the young VPs and C-Level executives you see got there because their careers were accelerated by joining a “rocket ship” company.

There is a big benefit of larger companies, though: You typically have a broader range of career options. You want to work on a different product? No need to leave the company, just switch teams. You want to move to a different city or country? Probably also possible.

TL;DR: Early-stage, high-growth companies offer the biggest growth opportunities (if the company is successful), but large companies provide flexibility.

There are many types of stress. It’s important to figure out which ones you can handle, and which ones are deal-breakers for you.

At fast-growing early-stage companies, the main source of stress comes from:

  • Changing priorities: In order to survive, startups need to adapt. The original plan didn’t work out? Let’s try something else. As a result, you can rarely plan longer than a few weeks ahead.
  • Fast pace: Early-stage companies need to move fast; after all, they need to show enough progress to raise another financing round before they run out of money.
  • Broad scope: As mentioned above, everyone in an early-stage company does a lot of things; it’s easy to feel stretched thin. Most of us in the analytics realm like to do things perfectly, but in a startup you rarely get the chance. If it’s good enough for now, move on to the next thing!

In large companies, stress comes from other factors:

  • Complexity: Larger companies come with a lot of complexity. An often convoluted tech stack, lots of established processes, internal tools etc. that you need to understand and learn to leverage. This can feel overwhelming.
  • Politics: At large companies, it can sometimes feel like you’re spending more time debating swim lanes with other teams than doing actual work.

TL;DR: Not all stress is created equal. You need to figure out what type of stress you can deal with and choose your company accordingly.

There is no one-size-fits-all answer to this question. However, my personal opinion is that it helps to do at least one stint at a reputable big tech company early in your career, if possible.

This way, you will:

  • Get pedigree on your resume that will help you get future jobs
  • See what a high-performing data infrastructure and analytics org at scale looks like
  • Get structured onboarding, coaching and development

This will provide you with a solid foundation, whether you want to stay in big tech or jump into the crazy world of startups.

Working at a small startup, growth stage company or FAANG tech company is not inherently better or worse. Each company stage has its pros and cons; you need to decide for yourself what you value and what environment is the best fit for you.

For more hands-on advice on how to scale your career in data & analytics, consider following me here on Medium, on LinkedIn or on Substack.


Source link

Protected by Security by CleanTalk